How to make a Gantt chart
- Name your project, then add each task with a start date and the number of days it takes.
- Chain tasks with “After”, mark how much is done, and give groups of tasks the same colour.
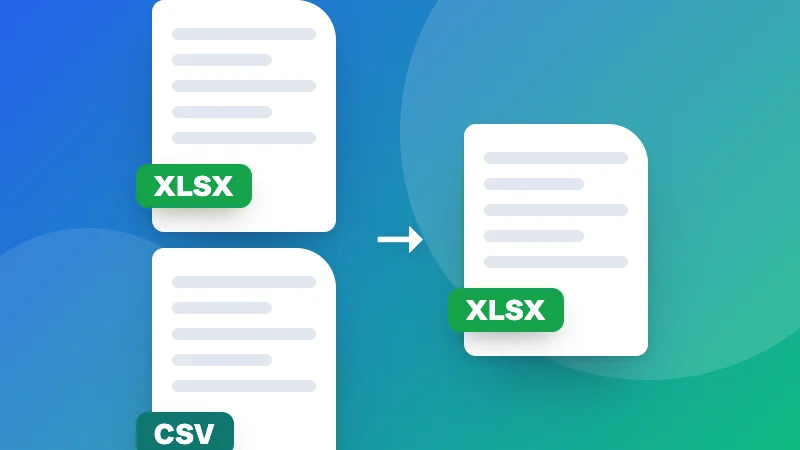
- Download the chart as a PNG, SVG or PDF, and the task list as a CSV for Excel.
What a Gantt chart shows
Each task is a bar on a calendar: where it starts, how long it takes and how much is done. Arrows show which tasks wait for others, and diamonds mark milestones. It's the quickest way to see if a project will finish on time.
Planning the steps instead of the dates? Use the flowchart maker. Tracking hours? Try the timesheet calculator.
Frequently asked questions
How do I make a Gantt chart?
Add a row for each task with its start date and how many days it takes. The chart draws the timeline as you type. Set “After” to make a task start when another one ends, and it moves by itself when the earlier task changes.
Can it skip weekends?
Yes. Tick “Working days only” and the days are counted Monday to Friday, so a 5-day task that starts on Thursday ends the next Wednesday. Weekends are shaded on the chart.
How do I add a milestone?
Give the task 0 days. It's drawn as a diamond on its date, for deadlines, launches and meetings.
Can I use it in Excel or a presentation?
Download the chart as a PNG for slides and documents, an SVG or a PDF to print, and the tasks as a CSV file that opens in Excel or Google Sheets. You can also import a CSV with name, start date and days.
Is my project saved?
Yes, in this browser. Nothing is uploaded.